Odwiedź nas również na:


| In the context of practical use of MSA methods, including ARM method, it is highly important that we are able to interpret the results precisely. And this is not only about key indicators %GRR i ndc, but also %PV, %EV, %AV. It is also necessary to pay attention to stability of results collected (use of R chart), which many MSA „users” forget. This elaboration provides a detailed presentation of the way of analyzing results of ARM method (also referred to as GRR or R&R method). |
ARM method – outline of guidelines
With regard to assessing the effectiveness of control actions, at least a dozen methods are adopted. The selection of these methods depends on the nature of measurement (e.g. destructive or non-destructive) and on the subject of testing (e.g. is the measuring tool assessed only or also its use by controllers) [2]. One of the most popular is ARM method (also called R&R). It is based on averages and gaps calculated from data deriving from measurements of usually ten selected parts, conducted by three operators, each of whom performs three series of measurements [3]. A typical form of this analysis is the use of popular template available in MS Excel file – thus the purpose of this article, that is presentation of the method of analyzing results of ARM method documented in this form. Please refer to fig. 1 to see a typical template for ARM method.
Fig. 1. MS Excel template – ARM method
Source: [3]
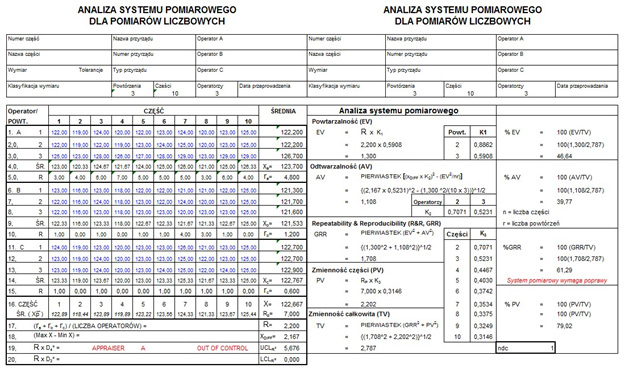
The template is composed of three basic sections:
From the point of view of reliability of results obtained through ARM method, it is important that you satisfy a few conditions:
The analysis itself consists in analyzing a series of indicators which reflect the quality of measurement system in question. Apart from %GRR and ndc, these are also %EV, %AV and %PV.
Results analysis – step 1
The first step of the analysis should be to check if the results collected do not show the so-called special disruption, that is values which seem to be atypical to the measurement system. This analysis in ARM method is carried out with the use of control chart for gaps known from SPC. As presented in the fig., the data collected demonstrate the special disruption in the operator marked as A. When measuring the item no. 4, we observed a surprisingly large discrepancy between the results. There is a number of potential causes, starting from wrongly entered result and ending up with dirt on the part in question. It is important that we identify and eliminate the cause of such disruption, and then repeat the measurements. If not for this, further calculations are likely to be erroneous.
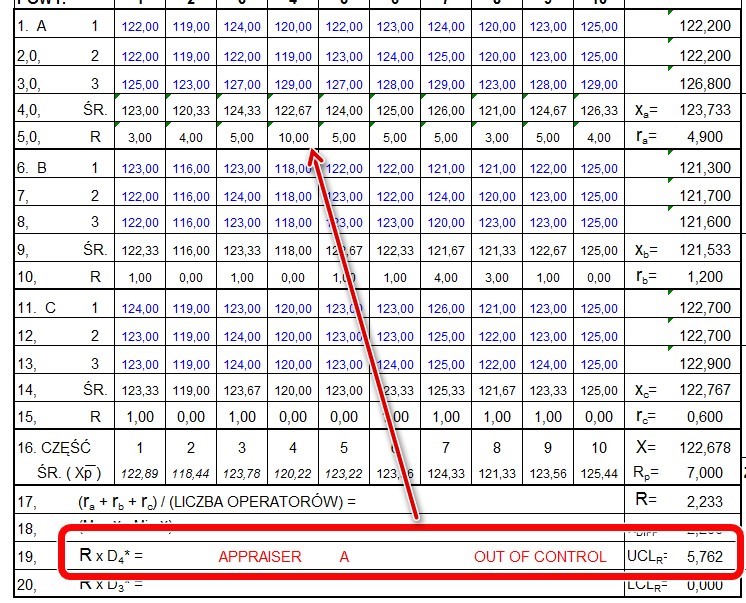
Fig. 2. Analysis of measurement stability in ARM method
Source: Own elaboration
In ARM analysis is it essential that we choose the reference value (the so-called RF value) for the results obtained. If MSA analysis is aimed at approving the measurement system for quality control, the reference value should be a tolerance field width (Tol); if the system is required to control processes (SPC), the reference value should be a total variability of the measurement system (TV) – fig. 3.
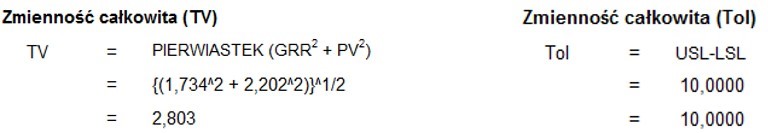
Fig. 3 Reference values in ARM analysis
Source: own elaboration
Results analysis – step 2
The second step of the analysis should be to check if parts for the study have been selected well. As mentioned before, the parts should represent the entire scope of tolerance or scope of process variability. The indicator which informs about range of parts is %PV. There are no specific guidelines for analysis of this indicator (there are no correct and required values), yet this value may be subject to analysis.
If tolerance field width has been used as the reference value (fig. 4) and %PV values exceeds 100%, it will result from selection of parts out of the tolerance range. The consequence of this may be „artificially” improved %GRR and ndc values. They are based directly on PV value.
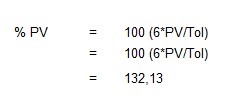
Fig. 4. Sign of badly selected parts for ARM analysis
Source: own elaboration
Low %PV value means that the parts used for the study were very similar to one another. For this reason, even minor errors, e.g. repeatability, will have a significant impact on %EV, %AV and %GRR indicators.
We may risk a claim (or tip) that well-selected parts for the study should have %PV value above 75%, but should not exceed 100%.
Results analysis – step 3
The indicators which summarize ARM analysis are %GRR and ndc. In accordance with automotive industry guidelines [3], %GR should be lower than 10%. Starting from this value and ending up with 30% (inclusive), the system may be accepted conditionally. %GRR above 30% shows the system cannot be accepted due to issues related to repeatability or reproducibility of results (fig. 5).

Fig. 5. Examples of ARM analysis results
Source: own elaboration
Ndc value should be at least 5. The systems with ndc below this value have a low reliability due to the fact that with reference to PV, the repeatability and reproducibility errors are too high. The results presented in fig. 5 demonstrate a very poor measurement system. %GRR indicator exceeds the permissible 30% considerably, while ndc does not reach the minimum value. Such poor results cannot be explained by badly selected sample because %PV is close to 80%. It is therefore necessary to find the cause of such results in order to improve the measurement system.
Results analysis – step 4
If %GRR and ndc values are not satisfying, it is necessary to take a look at repeatability results (EV) and reproducibility results (AV). They will show the root of the problem in the measurement system (fig. 6).
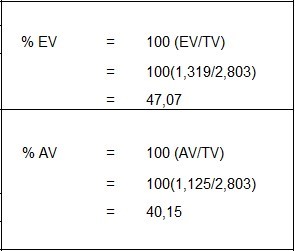
Fig. 6. Repeatability and reproducibility indicators
Source: own elaboration
With regard to the results analyzed in this article, the problem is associated with repeatability (%EV almost 50%) and reproducibility (%AV above 40%). It is necessary to return to source data in order to check where the problem emerged (fig. 7).
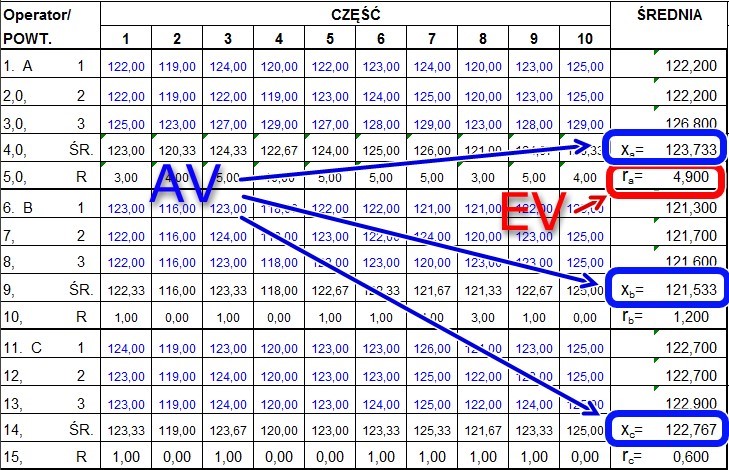
Fig. 7. Source results for ARM analysis
Source: own elaboration
Having analyzed the data collected, we can see that the biggest discrepancy, being as many as 4,9 (with values 0,6 and 1,2 for other measuring persons), applies to operator A. His discrepancy raised the EV value substantially, that is influenced the repeatability problem essentially. If the discrepancy of results of this operator in particular trials had not been higher than the one of the operator B (Rb=1,2), %EV value would have dropped substantially (from about 47% at present) to about 23%. Thus, with relatively low reproducibility, such system would be accepted conditionally.
As for reproducibility problems, it is difficult to find the guilty at first sight. If we return to repeatability issues, you can see the problem from a different point of view. %EV indicator was overstated by operator A, but importantly a high value Ra=4,9 for each part was a result of overstated result of third measurement series. Here we have a fixed cause which led the last series of the operator A (only this) to give higher results. It could turn out that before the first measurement was taken, the measuring device had been wrongly resetted or some pollutant was stuck and for this reason the entire measurement series was distorted. If we repeated this series of 10 measurements of operator A, his Ra value would drop substantially and at this point (basing on first two series of measurements) we can risk a claim that it would reach a value of about 0,6-0,7. Also the average of results of operator A and average values of operators A, B and C would be about 122,35, 121,53 and 122,77, respectively. As we can see, the results of operator B are lower than two others’, hence there are problems with %AV value which would be about 27%. If operator B did not participate in the study, the reproducibility for operators A and C would be about 14%, which is a much better result.
Eventually, after correcting the third series of measurements of operator A and removing results of operator B, %GRR value dropped to about 23%, which allows conditional acceptance of the measurement system, especially that ndc value rose to 5 (fig. 8).
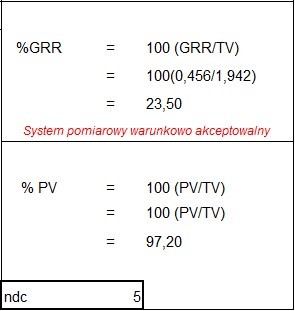
Fig. 8. ARM analysis results after modifications
Source: own elaboration
Summary
The results analysis presented in this article shows how important it is to understand all indicators in the ARM analysis. Their detailed analysis can demonstrate not only a general quality of the measurement system but also lead to improvements. Obviously the article adopts simplifications, changing particular results and making estimations, but the purpose of such operations was to show the influence of particular values of measurements taken by operators on final values of indicators in ARM method. It is also important that we remember that conclusions may be drawn if we use more advanced methods, including ANOVA analysis [1].
References
PROQUAL Management Institute
B. T. Greber Spółka Jawna